Vn






Working Principle for Bread Texture Analysis
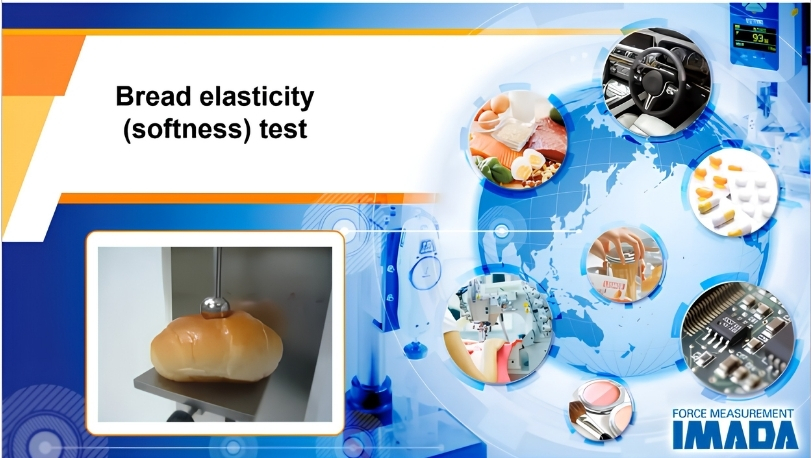
Bread texture, particularly firmness (softness), is evaluated using a rheometer to compress the bread sample. The instrument quantifies softness based on the measured force and allows users to compare differences in force at different locations within the bread, such as the crust and crumb.
The measurement data can be managed and analyzed to compare different bread formulations, verify baking times, and evaluate changes in texture over time. This supports product quality evaluation, quality control (QC), and research and development (R&D).
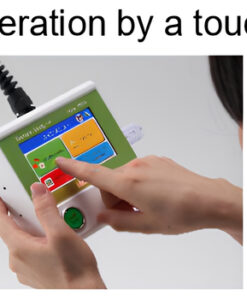
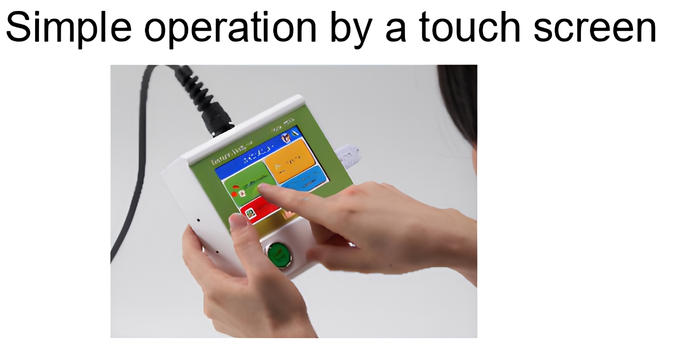
The instrument is easy to operate. Users simply select the food type to be tested on the touchscreen.
Video demonstrating the Imada instrument performing a bread softness test:
What Can Bread Texture Testing Evaluate?
The measurement results can be used to:
- Compare different bread formulations
- Verify processing and baking times
- Monitor changes in texture over time
- Evaluate and control product quality
- Support product research and development (R&D)
Similar Food Samples Suitable for Texture Testing Include:
- Bread
- Sponge cake
- Dough
- Rice balls
Equipment Used for Bread Softness Testing – IMADA FRTS Series Food Texture Analyzer
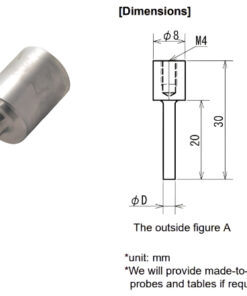
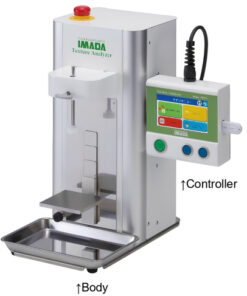
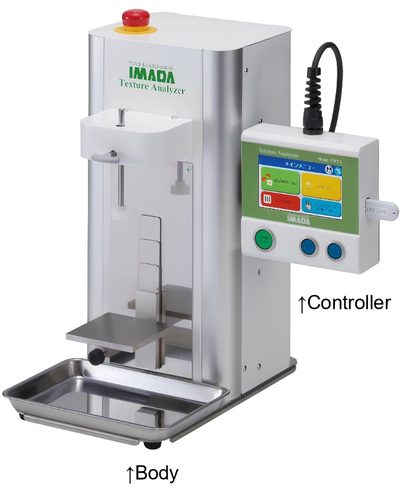
For bread softness testing, IMADA uses the Food Texture Analyzer FRTS-50N. The instrument quantitatively evaluates food texture based on measured force, with measurement units including N, kgf, and lbf. The FRTS Series can be equipped with various probes and attachments to accommodate different sample types and testing methods.
Simple Touchscreen Operation
The operator can select the food type or test standard on the touchscreen. The instrument then displays the recommended measurement conditions and the appropriate attachment to use. Preset measurement conditions can be modified and saved for future use.
Data Analysis and Comparison Using Graphs
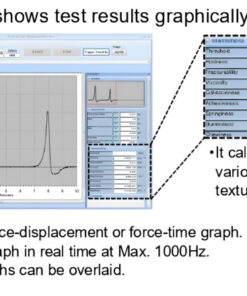
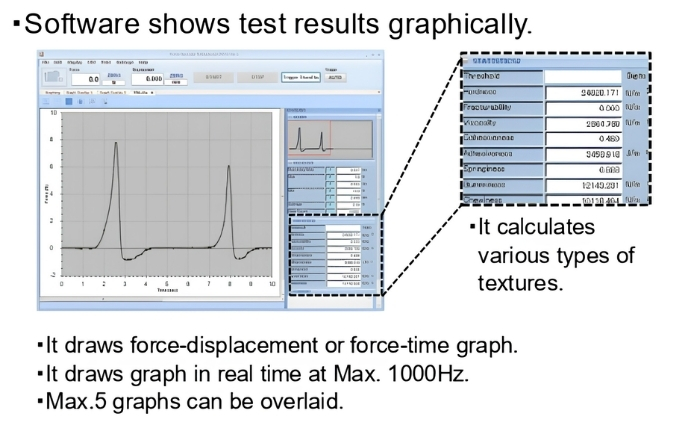
Measurement data can be saved via USB and analyzed using the included software. The software displays force–displacement or force–time graphs, records data at a maximum rate of 1,000 Hz, and allows up to 5 graphs to be overlaid for result comparison.
Easy to Clean
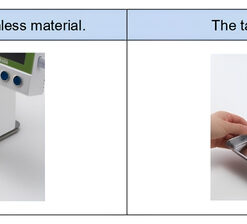
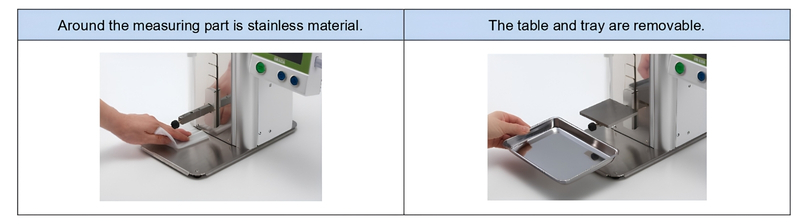
The measurement area is constructed from stainless steel, while the sample table and tray can be removed for convenient cleaning after food texture testing.
FRTS Series Models
| Model | FRTS-5N | FRTS-50N | FRTS-100N |
| Measurement Range | 5 N | 50 N | 100 N |
| Resolution / Scale Division | 0.005 N | 0.050 N | 0.100 N |
IMADA FRTS Catalogue
IMADA FRTS Food Texture Analyzer Catalogue
Related Product: See also the IMADA Solution for Testing Sponge Cake Softness and Fluffiness